Asia-Pacific Biologics CMO Facilities
$1,999.00
Access in-depth research and analysis of key Biologics Contract Manufacturers operating in key Asian markets – China, Taiwan, Korea, Japan, Southeast Asia, India and Australia.
- Description
- Additional information
Description
- Overview
- Scope
- Benefits
- Key Questions Answered
- Data Methodology
- Table of Contents
- Figures & Tables
- User Access
Asia-Pacific Biologics CMO Facilities report features data analysis of companies manufacturing large molecules such as Monoclonal Antibodies, Recombinant Proteins, Cell Therapy, Bi-Specific Antibodies, Vaccines and more. The report covers the following regions: China, South Korea, Japan, Taiwan, India, Singapore, Australia, and SEA. It sheds light on the facility design, services offered, bioprocessing technologies currently used across the manufacturing value chain (starting from cell-line development until fill & finish), plant capacity, facility type (single-use vs stainless steel) and facility investment.
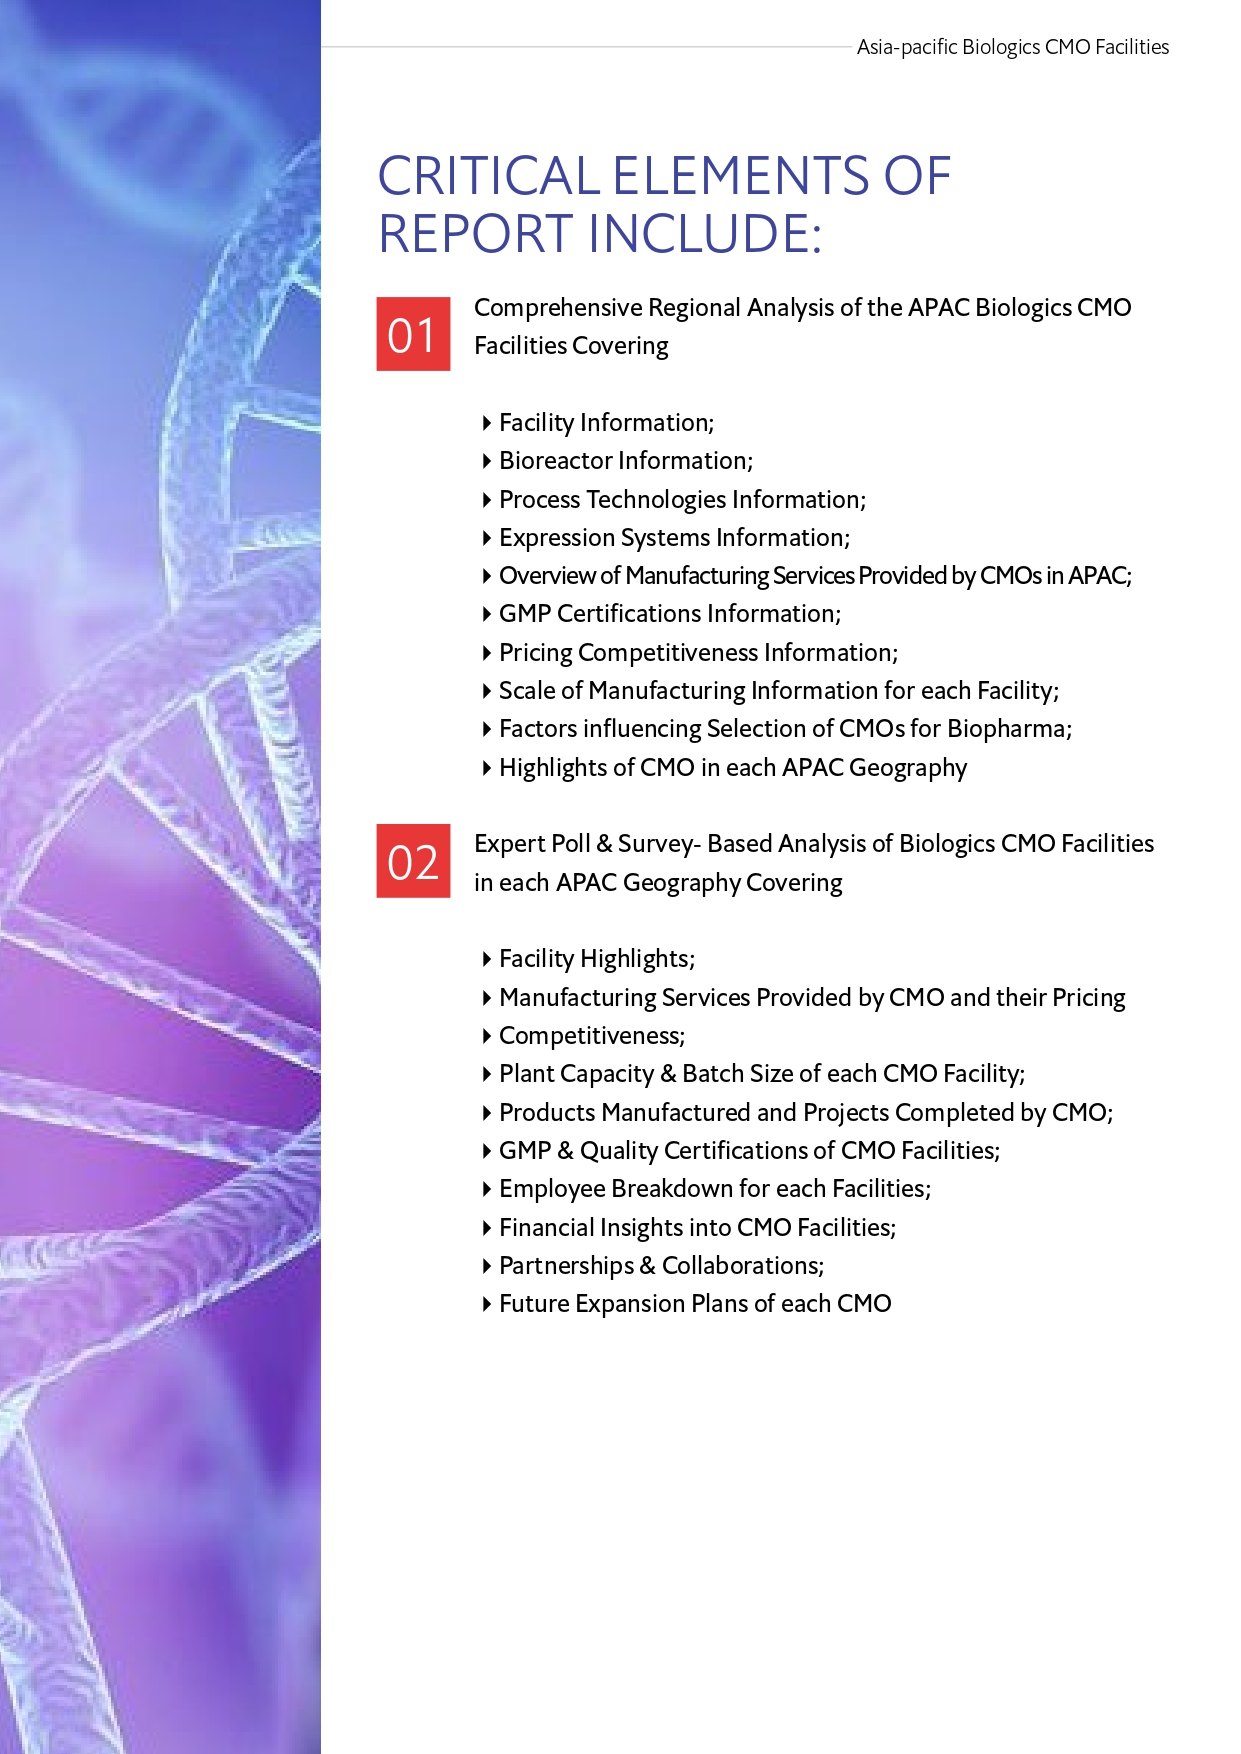
The report provides insights on the following topics but not limited to:
Scale of manufacturing of Biologics Facilities
Manufacturing services provided by CMOs
Products manufactured and projects completed
Team- distribution
Plant capacity and facility size
Facility investment
Batch Size and type of bioreactors used
Facility design
Process technologies employed in facility
GMP certifications
Future expansion plans of CMOs
The first and second section of the report presents preface and executive summary. It enlists the major topics covered in the report.
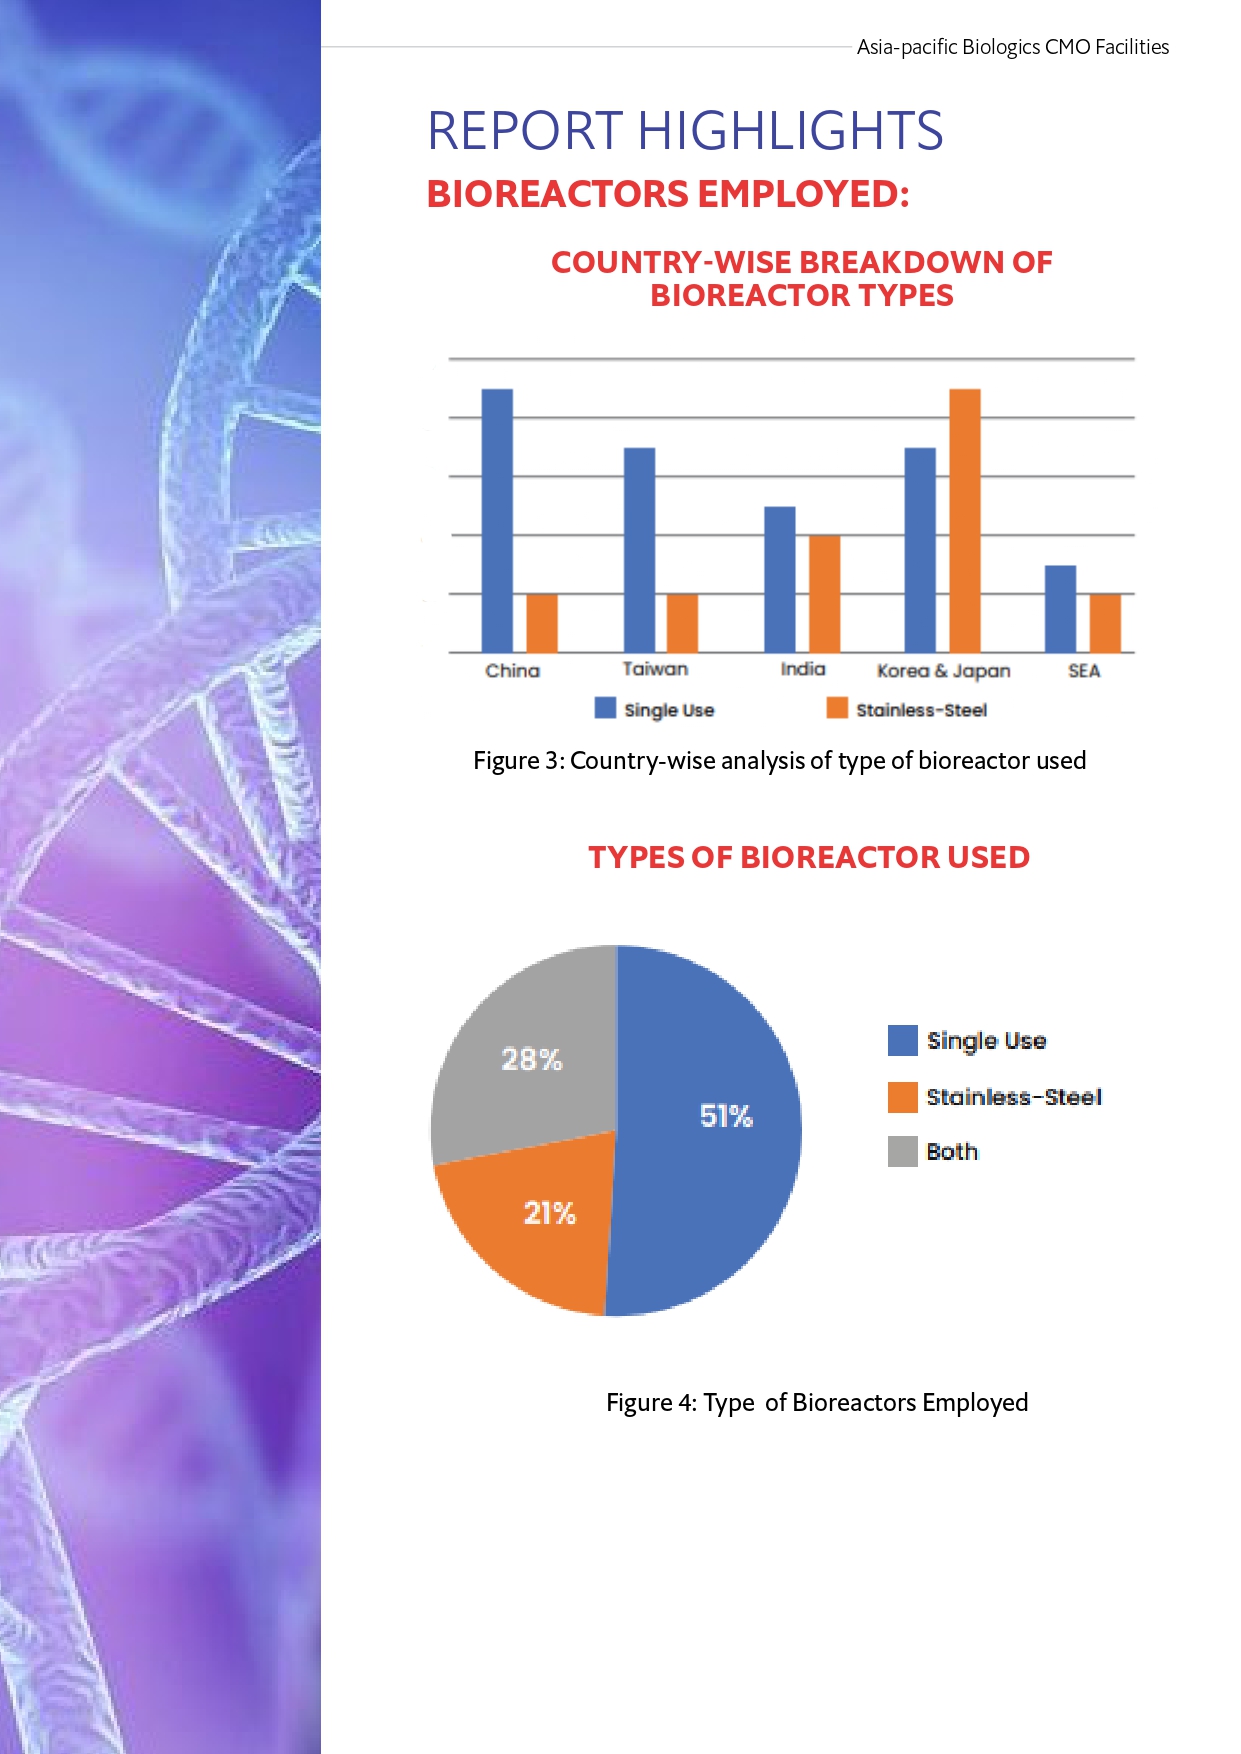
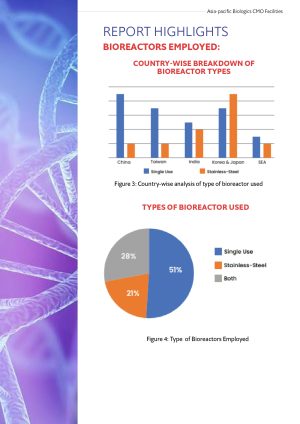
The third section provides detailed qualitative and quantitative analysis of the CMO’s in the APAC region such as bioreactors employed, process technologies used, team-distribution, regional wise analysis of the expression systems, GMP certifications, facility investments, size and so on. For instance, the analysis reveals that in the APAC region, China is currently taking a lead in the Single-use systems while CMO’s in Korea such as Binex, Samsung BioLogics and Hanmi has either a hybrid facility or a full-stainless steel facility. Some of the reasons associated with such usages are covered in the sections that follow.
Majority of the CMOs discussed in this report have employed batch or fed-batch processes. However, closer look at those companies show that they are moving towards adapting continuous processing manufacturing technologies as part of their future expansion plans. Moreover, some companies have both processes to offer depending on the product type of their clients.
The fourth section has expert poll and survey analysis which studies respondent profiles, CMO’s brand perception as voted by Biopharma companies, and other significant points of consideration for Biopharma organizations. The respondent analysis with figures and charts on the job title, stage of production and manufacturing capabilities can be found in this section.
The fifth section of the report has detailed highlights and features of biopharma contract manufacturers of Asian countries. It provides brief data on CMO services, facilities and products in manufacturing.
The last section of the report includes comprehensive research-based data on biologics CMOs from greater China, India, Korea, Japan, Southeast Asia and Australia. It includes data on several parameters such as manufacturing services provided by CMO and their Pricing, competitiveness, plant capacity & batch size of each CMO facility, products manufactured and projects completed by CMO, GMP & quality certifications of CMO facilities, employee breakdown and financial insights, partnerships & collaborations and future expansion plans of each CMO.
The option to customize the report is available upon request to meet your data requirements for example any specific country or market data from SEA market. The customized report is comparatively cost-effective and dependent on data requirements.
The CDMO market in APAC has been steadily growing in the recent years. More companies are bringing their products into the clinical trials phase and are choosing to out-source to a full-service CDMO rather than several niche providers. Many pharmaceutical companies are out-sourcing their manufacturing to service providers to reduce costs and make use of the technologies that manufacturers are developing, which they might not have access to.
Within the scope of the report, IMAPAC Pte Ltd has performed an analysis of the CMOs in the region to highlight the various services provides and trend of technologies used in the biomanufacturing. The study focuses on the various Contract Manufacturing Organisations in Asia. This includes companies from China, Taiwan, Korea, Japan, India, SEA and Australia.
Following the trend in the APAC CMO market, biotech and pharmaceutical companies are opting for CMO services to speed up their development process and lower the production costs. In 2019, the biologics segment held the largest market share in the biopharmaceutical contract manufacturing market in Asia Pacific. With that in consideration, the report includes meaningful insights to enable biopharma and pharmaceutical companies to understand the CMO market landscape in Asia through detailed analysis of the various contract manufacturers who are operating in the region since 2005.
The report reveals that greatest number of plants were built in 2019. Further, the insights in these reports are valuable for CMOs or CDMOs as well, to understand their competitors’ facilities better in terms of the services offered, plant capacities, future expansion plans and so on.
IMAPAC Pte. Ltd. has released this report with an objective to support key industry stakeholders in the biologics manufacturing through strategic collaboration with contract manufacturing organizations for outsourcing manufacturing activities or gain deeper understanding of CMO facilities across APAC.
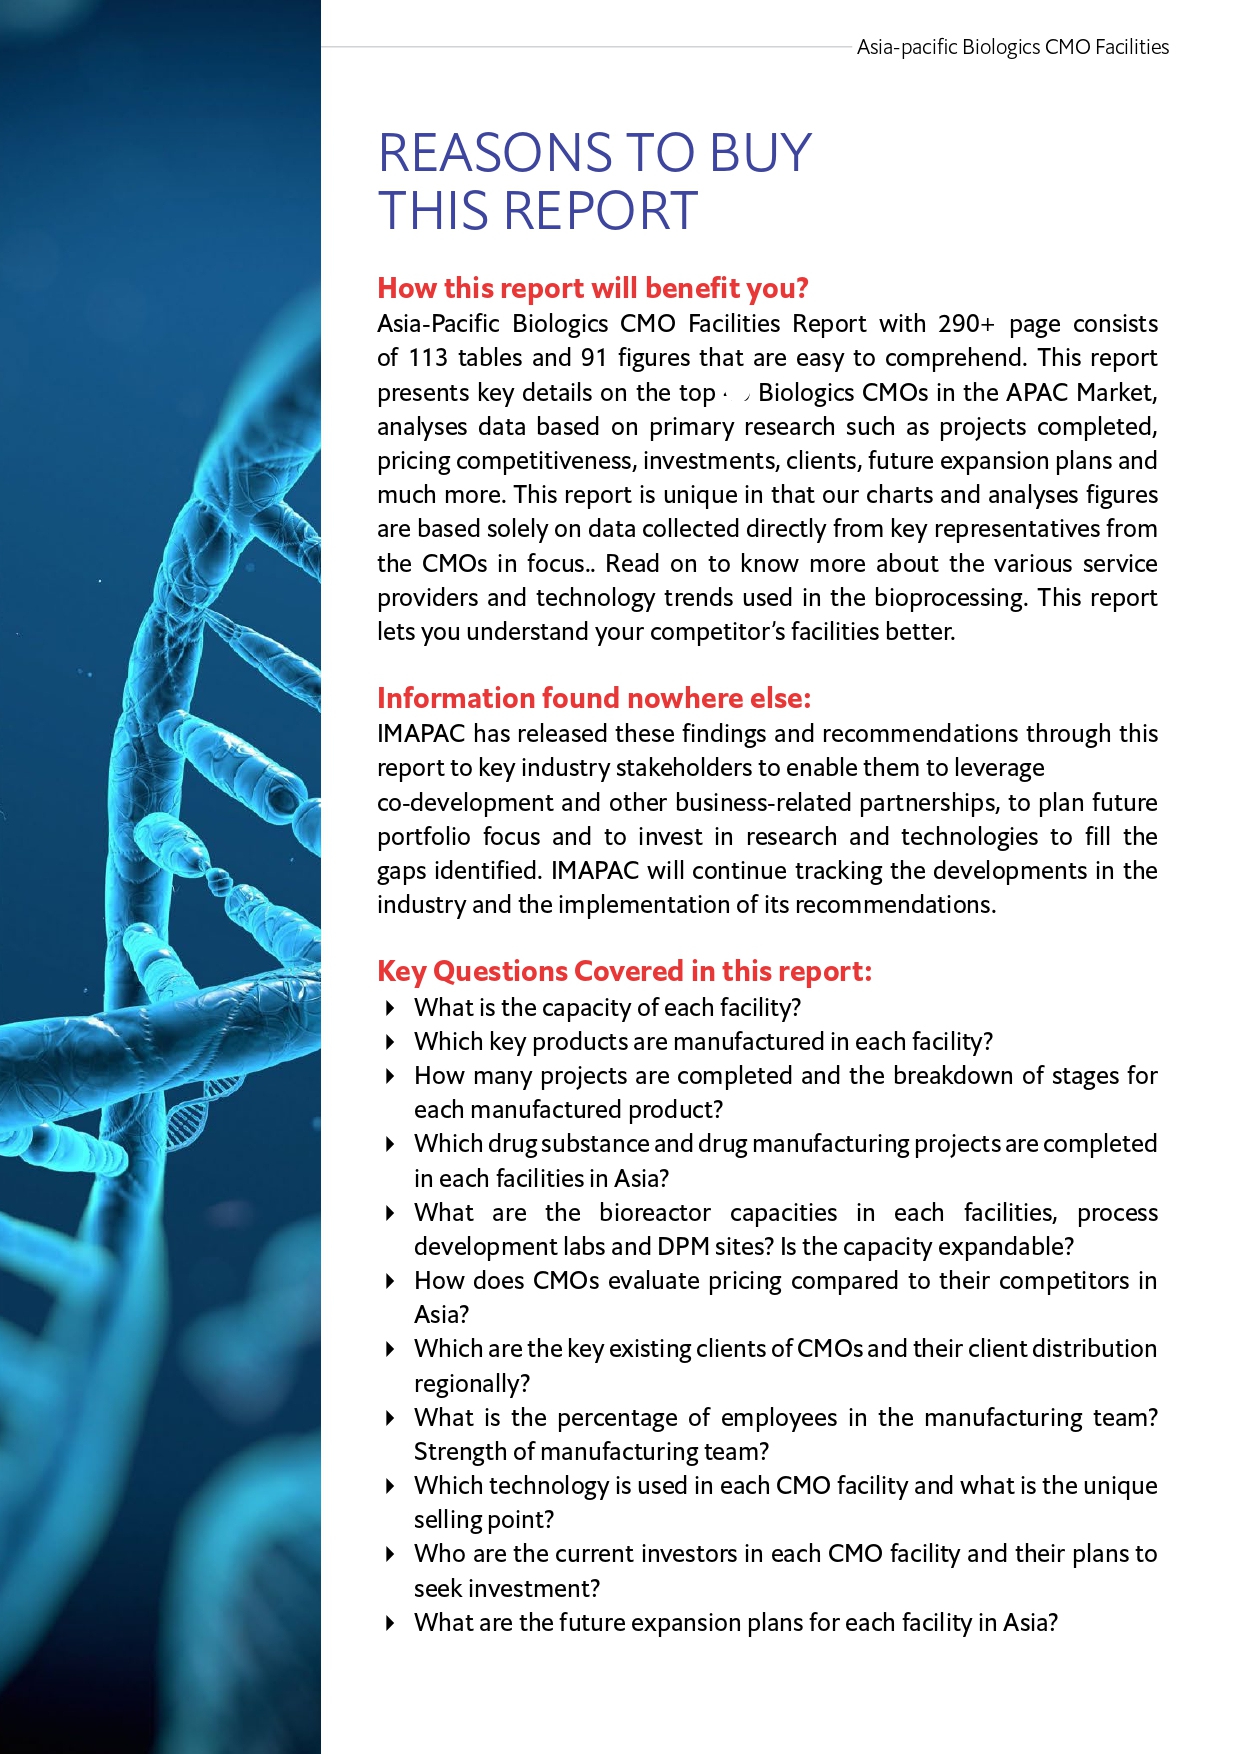
Asia-Pacific Biologics CMO Facilities Report with more than 290 page consists of 113 tables and 91 figures that are easy to comprehend. This report presents key details on the top Biologics CMOs in the APAC Market, analyses data based on primary research such as projects completed, pricing competitiveness, investments, clients, future expansion plans and much more.
This report is unique in that our charts and analyses figures are based solely on data collected directly from the biopharma and big pharma on the various CMOs of their choice in each region. The survey respondents’ companies are either currently manufacturing their products in- house or outsourcing their manufacturing activities to a CMO. Read on to know more about the various service providers and technology trends used in the manufacturing. This report lets you understand CMO’s facilities better.
Through this report, you are more likely to stay ahead of your competitors and expand your knowledge and expertise in biomanufacturing. Identify co-development and other business-related partnerships, to plan future portfolio focus and to invest in research and technologies to fill the gaps identified.
This report may potentially help your research, analyses, and strategic decisions. IMAPAC’s Report is intended for anyone who demands comprehensive and in-depth analyses for Biopharma contract manufactures in key Asian markets.
- Which is the largest facility in Asia for biologics clinical or commercial manufacturing?
- Which CMO is preferred highly by the Biopharma or pharmaceutical companies in Asia?
- What are the manufacturing services provided by the CMOs?
- Which key products are manufactured in CMO’s facility?
- How many projects are completed and the breakdown of stages for each manufactured product?
- Which drug substance and drug manufacturing projects are completed in each facility in Asia?
- What are the bioreactor capacities in each facility, process development labs and DPM sites? Is the capacity expandable?
- How does CMOs evaluate pricing compared to their competitors in Asia?
- What are the key factors of consideration for Biopharma companies while selecting the CMOs?
- Which are the key existing clients of CMOs and their client distribution regionally?
- What is the strength of manufacturing team?
- What type of equipment and technologies are used by CMOs and what is the unique selling point?
- Who are the current investors in each CMO facility and their plans to seek investment?
- What are the future expansion plans for CMOs in Asia?
The data in this report is researched and validated using primary and secondary research. The data is collected through multiple scientific and non-scientific sources including live discussions with experts through IMAPAC’s events and research reports, company websites, press releases, publicly available information, regulatory database and many more.
Preface
Executive Summary
CMO Landscape in APAC
Report Scope
Regional Analysis of the Bioprocessing Facilities
Year of Establishment of Facility
Bioreactors Employed
Process Technologies Employed
Expression Systems
Services Offered
GMP Certifications
Facility Investment
Pricing Competitiveness
Facility Size
Scale of Manufacturing
Employee Distribution
Expert Poll & Survey Analysis
Respondent Profiles
CMO Brand Perception- Voted by Biopharma
Points of Consideration of Biopharma
CMO Highlights
CMO Facilities in Greater China
Amaran Biotech
Boehringer Ingelheim
Chime Biologics
Cmab Biopharma
Eirgenix
Innovent Biologics
Jhl Biotech
Lonza (China)
Mabplex
Mycenax
Obio Technology
Sinobioway (Pku Biologics)
Sunshine Guojian (3s Bio)
Taron Solutions
Unicocell
United Biopharma
Wuxi Atu Co., Ltd
Wuxi Biologics
CMO Facilities in India
Enzene Biosciences Ltd
Intas Pharma
Kemwell Biopharma
Stelis Biosource
Syngene
CMO Facilities in Korea
Binex
Eubiologics
Hanmi Pharma
Kolon Life Sciences
Samsung Biologics
CMO Facilities in Japan
AGC Biologics
Ajinomoto Pharma Services
Hitachi
ID Pharma
Medinet
Takara Bio
CMO Facilities in South-East Asia
Esco Aster
Lonza AG Singapore
PT Kalbio Global Medika
TCels
CMO Facilities in Australia
Cell Therapies Pty Ltd
Luina Bio
List of Tables
Table 1: Services offered by CMOs in China
Table 2: Services offered by CMOs in Taiwan
Table 3: Services offered by CMOs in India
Table 4: Services offered by CMOs in Korea and Japan
Table 5: GMP Certifications received by the CMOs
Table 6: Scale of manufacturing for the CMOs featured
Table 7: Facility highlights of Boehringer Ingelheim
Table 8: Facility highlights of Chime Biologics
Table 9: Different components of facility in Chime Biologics
Table 10: Wuhan Facility Overview: Chime Biologics
Table 11: Details of bioprocessing equipment, model of equipment, & solution providers of Chime Biologics’s manufacturing facility
Table 12: Facility highlights of CMAB
Table 13: Facility Highlights of Hsinchu Biomedical Park, Zhubei: Eirenic
Table 14: Bioprocessing equipment in Eirgenix’s mammalian cell culture facility
Table 15: Bioprocessing equipment in EIrgenix’s microbial fermentation facility
Table 16: Break-down of the bioprocessing facility in Eirgenix
Table 17: Product pipelines of Eirgenix
Table 18: Future expansion plans from stage 1, 2 and 3 of Eirgenix
Table 19: Facility highlights of Innovent Biologics
Table 20: Product pipeline of Innovent Biologics
Table 21: Facility overview and highlights of JHL Biotech
Table 22: Management Team of JHL Biotech
Table 23: Summary of bioprocessing equipment models and the solution providers associated with JHL Biotech manufacturing facility
Table 24: Facility highlights of Lonza (China)
Table 25: Facility highlights of Mabplex
Table 26: Production capabilities by size of Batch of MabPlex
Table 27: Linkages, linkers and payloads offered by MabPlex
Table 28: Facility highlights & overview of Mycenax
Table 29: Capacity and Batch Size for both the liquid and lyophilised form
Table 30: Technology platform in Mycenax’s bio-manufacturing facility
Table 31: Highlights of plant capacity: Mycenax
Table 32: Mycenax Biomanufacturing Plant Highlights
Table 33: Details of current aseptic filling line in Mycenax facility
Table 34: Product pipelines of Mycenax
Table 35: Product Pipeline: Mycenax
Table 36: Breakdown of Projects completed
Table 37: Facility highlights of Obio technology
Table 38: Facility highlights of Sinobioway
Table 39: Production line facilities and their batch sizes; 3S Bio
Table 40: Preparation filing line and the capacities; 3S Bio
Table 41: Facility highlights of Taron Solutions
Table 42: Facility highlights of Unicocell
Table 43: Bioprocessing tools and equipment used and their solution providers; Unicocell
Table 44: Facilities overview and highlights of United Biopharma
Table 45: Overview of 3 plants of United Biopharma
Table 46: Types of bioreactors in Plant in Taiwan
Table 47: Types of bioreactors in Plant in Yangzhou
Table 48: Overview of R&D Centre and Industry Scale Manufacturing Plant in Taiwan
Table 49: Overview of Pilot Scale Manufacturing Plant in Yangzhou
Table 50: Overview of the equipment in the quality control laboratory of Taiwan plant
Table 51: Wuxi Biologics’ manufacturing footprint and global locations
Table 52: Facility highlights of Enzene’s Manufacturing plants in Pune
Table 53: Facility highlights of Intas manufacturing facility
Table 54: Pipeline pf Plasma derived products
Table 55: Pipeline of Intas’s Biosimilars
Table 56: Progressive pipeline of products in the manufacturing facility
Table 57: Facility highlights of Kemwell’s manufacturing plant in Banglore
Table 58: Type and batch sizes of bioreactor used in Kemwell’s facility
Table 59: Liquid vial and lyophilised vial capacity; Kemwell Bipharma
Table 60: Equipment installed in Kemwell’s facility and their providers
Table 61: Kemwell’s Product pipeline and their stage of development
Table 62: Facility highlights on Stelis Biopharma’s Banglore facility
Table 63: Breakdown of Stelis Biopharma’s facility size into each space of the plant
Table 64: Process optimisation and capabilities for the two expression systems in Stelis Biopharma’s facility
Table 65: Drug substance manufacturing features and the respective expression systems in Stelis Biopharma’s facility
Table 66: Equipment used in Stelis Biopharma’s bioprocessing value chain and their provider
Table 67: Stelis Biopharma’s Fill and Finish Equipment and their features
Table 68: Investors of Stelis Biosource
Table 69: Services offered for large molecules at Syngene
Table 70: Cell line development, Process development, analytical development and product characterisation; Syngene
Table 71: Future expansion plans; Syngene
Table 72: Highlights of both Songdo and Osong manufacturing facilities: Binex
Table 73: Binex’s Songdo facility milestone timeline
Table 74: Binex’s Osong facility milestone timeline
Table 75: Various fill and finish systems employed and Binex’s capacities
Table 76: Process Technologies used in the various stages of development in Binex’s facility
Table 77: Types of products manufactured for their clients
Table 78: Products currently in the R&D pipeline in Binex’s facility
Table 79: Number of Batches of Drug Substance and Drug Product Manufacturing completed in Binex’s facility
Table 80: GMP inspection table for Binex
Table 81: Facility Highlights on both plant 1 and plant 2; Eubiologics
Table 82: Services offered by Eubiologics
Table 83: Fill and Finish capabilities of Eubiologics
Table 84: Type of bioreactor and batch sizes used in each of the expression systems in Eubiologic’s facility
Table 85: Equipment used in Eubiologic’s plant 1 and plant 2 in both the expression systems
Table 86: Bioprocessing equipment used across the Eubiologic’s value chain and their providers
Table 87: Facility highlights of Hanmi Pharma
Table 88: Annual Manufacturing Capacity; Hanmi Pharma
Table 89: Bioprocessing tools and equipment used by Hanmi ad their solution providers
Table 90: Production building 2 facility size; Hanmi
Table 91: Facility highlights of Kolon Life Science’s B1 and B2 plants
Table 92: Facility Size of both plants in square ft: Kolon Lifesciences
Table 93: Equipment used in the bioprocessing value chain for B1 facility and their providers
Table 94: Equipment used in the bioprocessing value chain for B2 facility and their providers
Table 95: Facility highlights of Samsung Biologics’ three manufacturing plants: Samsung Biologics
Table 96: Bioreactor sizes and their respective stage of production for each of the manufacturing plants: Samsung BioLogics
Table 97: CMP1 and CMP2 details; Samsung Biologics
Table 98: Drug Product manufacturing for plant 1 and 2: Samsung BioLogics
Table 99: Equipment used by their manufacturing plant and its provider: Samsung BioLogics
Table 100: Facility highlights of AGC Biologics
Table 101: Facility Highlights of Yokohama facility in Japan: Hitachi Chemical Advanced Therapetuics
Table 102: Management team of Medinet
Table 103: Facility highlights of Takara Bio
Table 104: Board Members of Takara Bio
Table 105: Case Study 1:293- cell bank
Table 106: Case study 2: E.Coli- cell bank
Table 107: Contractors of Takara Bio to build their CGCP
Table 108: Progress of Takara Bio’s main projects
Table 109: Services offered by Esco Aster
Table 110: Facility highlights of Lonza AG
Table 111: Facility highlights of KGM
Table 112: Bioprocessing tools, technologies and equipment used by KGM
Table 113: Facility highlights of LuinaBio
List of Figures
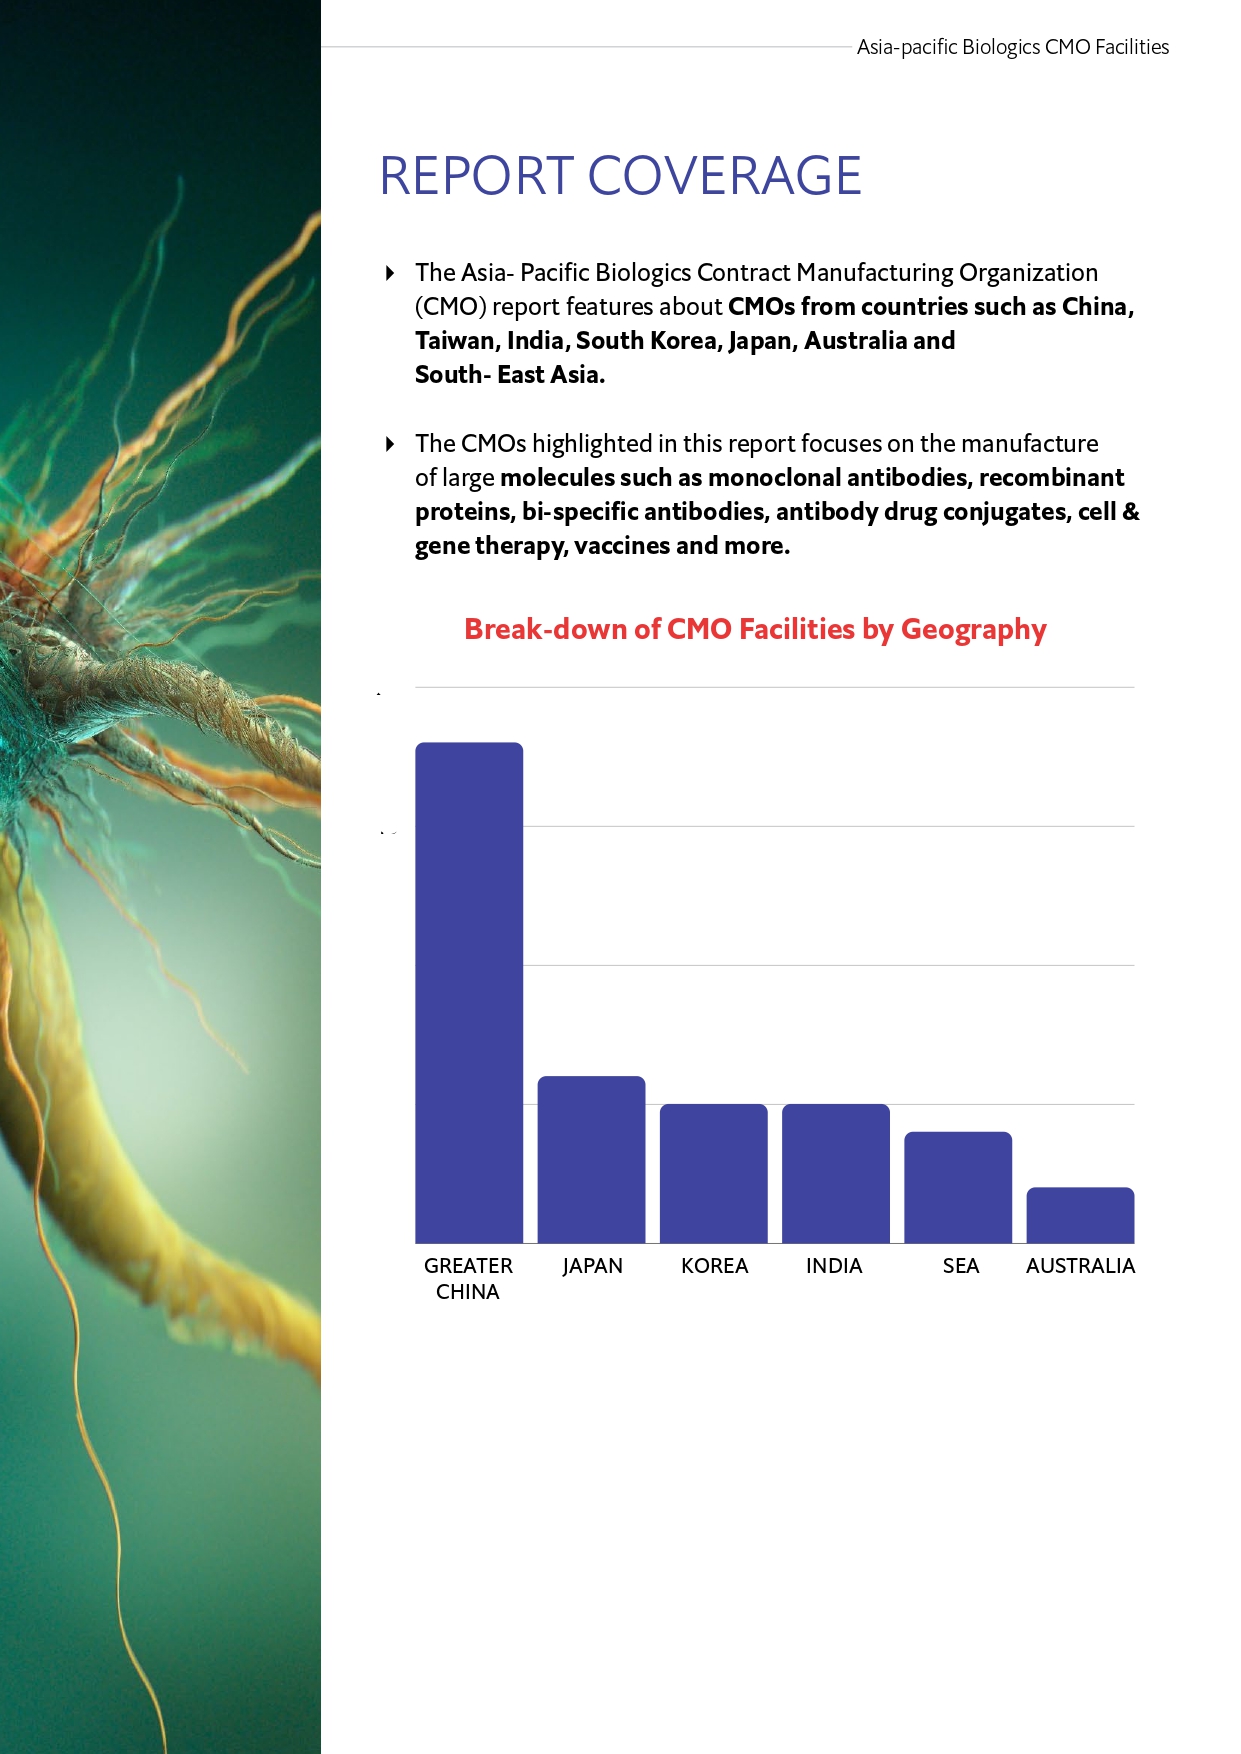
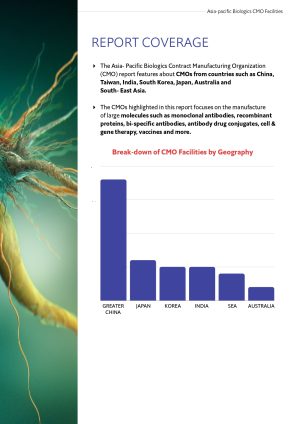
Figure 1: Country-wise breakdown of CMOs
Figure 2: Proportion of facilities built between 2005 to 2020
Figure 3: Country-wise analysis of type of bioreactor used
Figure 4: Type of Bioreactors Employed
Figure 5: Country-wise breakdown of Process technology used
Figure 6: Process Technologies Employed: Batch vs Continuous
Figure 7: Percentage of expression systems
Figure 8: Country-wise breakdown of expression systems used
Figure 9: Facility Investment in USD millions
Figure 10: Pricing competitiveness from 1 to 10 of companies
Figure 11: Facility size of the companies in square metres
Figure 12: Number of manufacturing versus non- manufacturing employees in each company
Figure 13: Main Line of Businesses: Eirgenix, Taiwan
Figure 14: Milestones Achieved: Innovent Biologics
Figure 15: Bioprocessing equipment inside Chime Biologics’s manufacturing facility
Figure 16: Bioprocessing technologies inside Chime Biologics’s manufacturing facility
Figure 17: Bioprocessing equipment in Chime Biologics’s manufacturing facility
Figure 18: Bioprocessing technologies in Chime Biologics’s manufacturing facility
Figure 19: Summary of services offered from drug discovery to commercialisation; CMAB Biopharma
Figure 20: Eirgenix’s commercial facility
Figure 21: CDMO services offered by Eirgenix
Figure 22: Capacity of Eirgenix’s Hsnichu Biologics Plant
Figure 23: Eirgenix’s mammalian and microbial manufacturing units
Figure 24: External look and interior design of Innovent Biologics manufacturing facility
Figure 25: Process technologies of JHL manufacturing facility
Figure 26: Progress on ADC validation and research at MabPlex
Figure 27: Elaboration on the services offered for Protein Characterisation; Mycenax
Figure 28: Process Technologies Used by Mycenax
Figure 29: Bioprocessing technologies and equipment in Mycenax’s bioprocessing facility
Figure 30: Different technology platform in Mycenax’s bio-manufacturing facility
Figure 31: Product Pipeline eat each scale of Production; Mycenax
Figure 32: Regulatory approval timelines of Mycenax’s bio-processing facility
Figure 33: Mixing System by Yingde Biology
Figure 34: Single Use Bioreactor: GE
Figure 35: ADC Platform for the R&D lab, Pilot and Production plant; CP Guojian
Figure 36: Manufacturing area in the GMP facility
Figure 37: Core technology of cell therapy manufacturing; Unicocell
Figure 38: Facility scale-up and development timelines of United Biopharma
Figure 39: Exterior outlook of plant in Taiwan. Source: United Biopharma
Figure 40: Exterior outlook and bioprocessing equipments in plant in Yangzhou
Figure 41: Global manufacturing sites of Wuxi AppTec
Figure 42: Manufacturing sites of WuXi ATU in China
Figure 43: Overview of services offered by WuXi ATU
Figure 44: Their footprint in Asia; WuXi Biologics
Figure 45: High-Impact Innovation: Concept to Market; WuXi Biologics
Figure 46: Late-stage development program contract consideration
Figure 47: Wuxi Biologics Site in Wuxi City
Figure 48: WuXi’s SUBs scaling out to meet demands
Figure 49: Scale Out using 2,000L Single use bioreactor; WuXi Biologics
Figure 50: Products manufactured and Projects in their pipeline; WuXi Biologics
Figure 51: R&D facility unit 1
Figure 52: cGMP Production Facility in MIDC, Chakan (Unit I) Pune, India
Figure 53: Manufacturing Plant in MIDC, Bhosari (Unit II), Pune India
Figure 54: Bioprocessing Technologies in E-Coli Manufacturing Unit
Figure 55: Bioprocessing Equipment in E-Coli Manufacturing Unit
Figure 56: Bioprocessing Technologies in E-Coli Manufacturing Unit
Figure 57: Bioprocessing Tools in E-Coli Manufacturing Unit
Figure 58: Bioprocessing equipment in Mammalian Manufacturing Unit
Figure 59: Bioprocessing technologies in Mammalian Manufacturing Unit
Figure 60: Stelis Biopharma’s facility expansion
Figure 61: Syngene’s mammalian facility
Figure 62: Syngene’s Viral testing plant
Figure 63: Overall Organisation Chart for Binex
Figure 64: Timeline for the whole process; Binex
Figure 65: Process flow from cell line development to manufacturing
Figure 66: GMP Manufacturing, manufacturing diverse types of biologics; Binex
Figure 67: Summary of their drug product manufacturing process flow
Figure 68: Overall layout of plant 1 in Chuncheon-si, Gangwon-do
Figure 69: 10,000L Fermentation/Recovery; Hanmi Pharma
Figure 70: For Hanmi’s Proprietary Long-Acting Protein Conjugate Technology
Figure 71: Prefilled syringe filling line; Hanmi Pharma
Figure 72: Services offered by Kolon Life Sciences
Figure 73: A closer look into the Process Development services offered; KLS
Figure 74: Equipment used in the facility; Kolon Life Sciences
Figure 75: Equipment used in the Quality Control area; Kolon Life Sciences
Figure 76: Services provided by Samsung Biologics
Figure 77: Graph of Samsung’s performance at cell line development
Figure 78: Their performance shift from cell line development to Process development
and during a change in media
Figure 79: Timelines from cell line development to IND; Samsung Biologics
Figure 80: Flask culture for CMP1 and 2
Figure 81: Approvals over the years; Samsung Biologics
Figure 82: Yokohama Plant; Hitachi Chemical Advanced Therapeutics Solutions
Figure 83: Hitachi: Counter-Flow Centrifugation System
Figure 84: Hitachi Equipment found in the development room in Hitachi
Figure 85: Medinet developing commercialised regenerative medical products/ investigational products
Figure 86: Medinet’s Shinagawa CPF building layout
Figure 87: Technologies adopted by Esco Aster
Figure 88: Roller Bottle Technology used in PT Kalbio’s Manufacturing Plant
Figure 89: Robotic Technology @ PT Kalbe’ Facility
Figure 90: Automated Chromatography Equipment: PT Kalbe
Figure 91: R&D Manufacturing Suites of TCELS
Figure 92: Control of apheresis collections through five modules; CPTL
Figure 93: Clinical trials extended to Australia
Figure 94: LuinaBio Facility Layout
Figure 95: Cost comparison between USA and Australia for early phase trials
Single – User Access
This license grants the right of use of the purchased report to a single recipient only. You may access the material on your computer, as and when required, for your own personal use.
Multi – User Access
Upto 3 users: This license grants the right of use of the purchased report by upto 3 users of the same firm/enterprise.
Corporate Access
Unlimited user access (Within your organization): This license entitles the buyer of the report to share, distribute the report (either full or in part) with other employees of the same firm/enterprise. The report may be accessed by any employee of the enterprise and there is no limit on the number of users.
Additional information
| User Access | Corporate Access, Multi – User Access, Single – User Access |
|---|






Reviews
There are no reviews yet.